- Introduction
- Guinn Center for Policy Priorities
- Data Science for the Public Good (DSPG)
- Introduction
- Virginia Department of Social Services: Mapping Family Relationships based on Administrative Data
- United Methodist Foster Services: Factors Impacting Retention of Foster Parents Older Foster Children with Special Needs
- Army Research Institute: Identifying Factors Impacting Community Embeddedness of Army Installations
- M.S. Thesis Project: Simulation-based Comparison of Tests for Heterogeneity of Risk Difference
Introduction
This portfolio includes several examples of my work and is intended to highlight several different elements of my knowledge and work experience. Please use the table of contents (above) to navigate to specific projects.
Guinn Center for Policy Priorities
Since 2019, I have worked as the Director of Data and Analytics at the Guinn Center for Policy Priorities, a nonpartisan policy research organization based in Nevada. In this role, I have led the collection, analysis, and visualization of data on diverse topics including healthcare, climate change, housing, and unemployment. A few highlights of my work for the Guinn Center can be found below.
Mapping Urban Heat
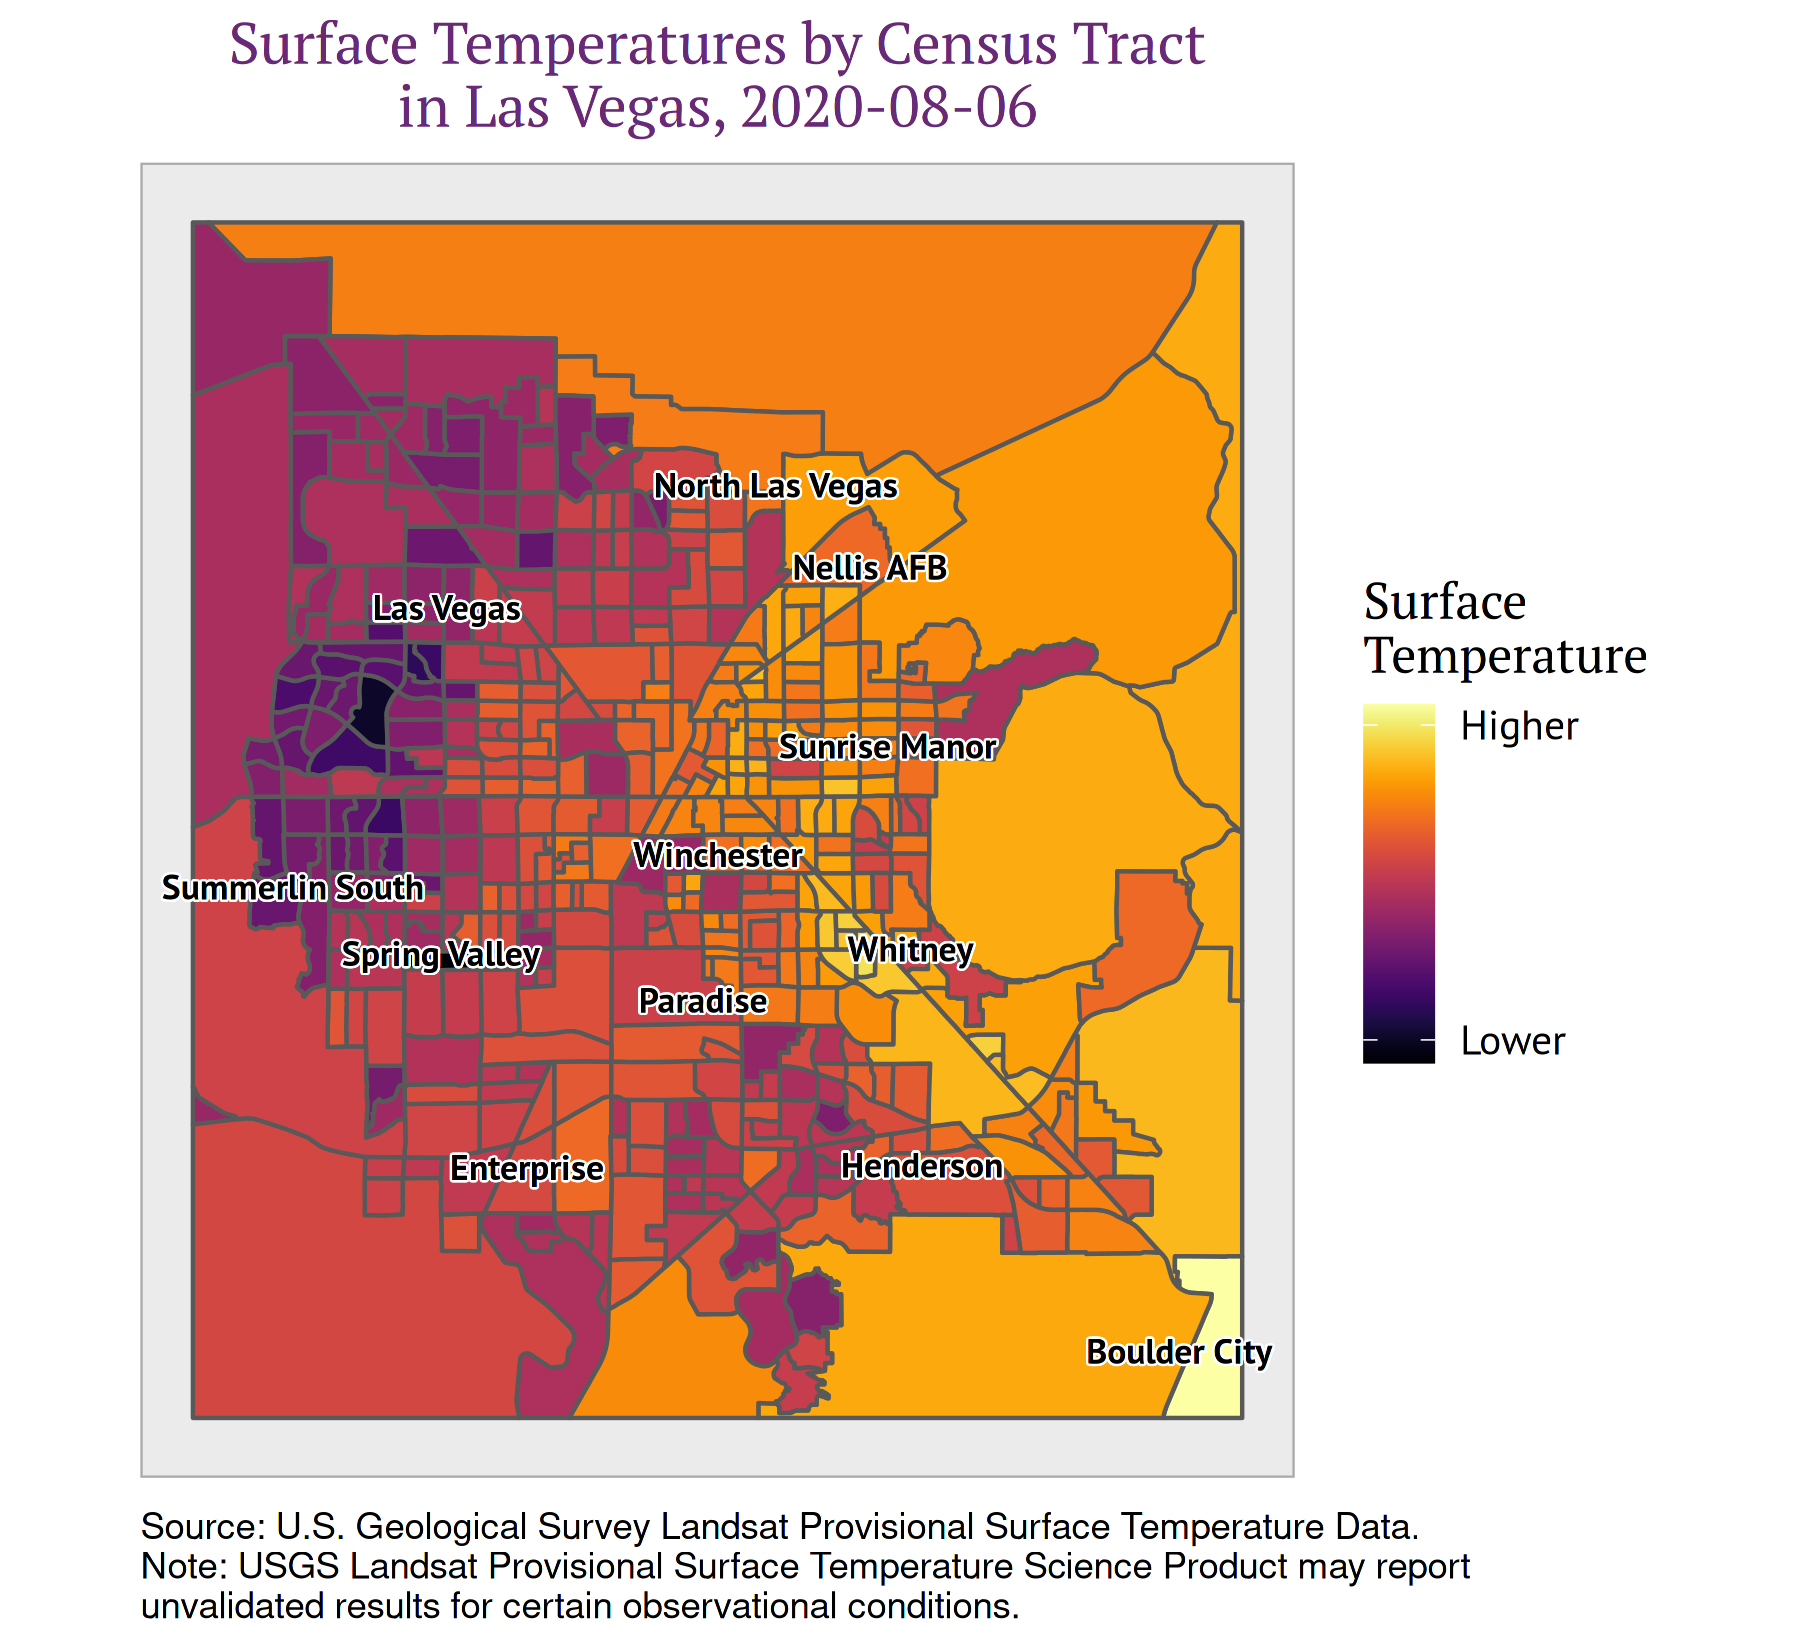
Figure 1: Visualizing Urban Heat by Census Tract in Las Vegas, Nevada
Urban heat is not distributed evenly within cities. Features such as parks or ponds can lead to cooler temperatures in some areas, while areas without foliage or with dark surfaces such as roads and buildings lead to warmer temperatures. This effect is particularly pronounced at night: urban surfaces absorb heat during the daytime, warming the air at night.
The goal of this project was to map land surface temperate data from the United States Geological Survey (USGS) Landsat 8 satellite and to aggregate the heat values into census tracts. This allowed us to compare urban heat with other metrics available at the census tract level, such as poverty and health insurance coverage.
More details on the mapping process can be found here.
Data Science for the Public Good (DSPG)
Introduction
I spent the summer of 2018 as a graduate fellow in Virginia Tech’s Data Science for the Public Good program. Students and fellows in this program collaborate with government and nonprofit organizations to solve problems related, broadly speaking, to the public good. I collaboared with other research fellows and led teams of undergraduate students working on projects for the Virginia Department of Social Services, United Methodist Foster Services, and the Army Research Institute.
Virginia Department of Social Services: Mapping Family Relationships based on Administrative Data
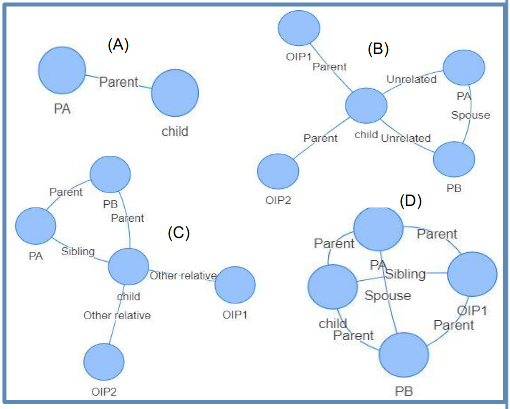
Figure 2: Sample Family Structures from the National Incidence Study of Child Abuse and Neglect (NIS)
The poster presentation for this project, presented at the 2018 Data Science for the Public Good Symposium in Arlington, VA, can be found here (the pdf may not show up online and it may need to be downloaded).
As with many departments of social services, the Virginia Department of Social Services (VDSS) operates and coordinates a range of services, including foster care, temporary assistance for needy families (TANF) benefits, child protective services, SNAP benefits, and medicaid. From a reporting standpoint, it can be difficult to keep track of how many distinct individuals and families the department is assessiting as many of the services under the VDSS umbrella classify individuals and families diffeerently.
Using data from the National Incidence Study of Child Abuse and Neglect (NIS), we built an R Shiny dashboard allowing the user to query different household or family structures and visualize the results. This served as a proof of concept that could ultimately be applied to VDSS’s databases, which share a similar structure. This approach allows different stakeholders within VDSS to use their specific organizations' definitions of family or household to search for relevant records. It is also a useful exploratory tool: households come in many shapes and sizes, and the ability to quickly visualize the family structures that meet certain criteria is helpful for ensuring that no one is left behind in the provision of social services.
We conducted unsupervised learning on the NIS family structure data. As the data comprised categorical and count data, we first used Random Forest to generate a dissimilarity measure between observations. Unlike most other unsupervised learning methods, Random Forest handles non-continuous features without difficulty. We then used k-medoids clustering as implemented in the cluster package in R. The clusters obtained were primarily defined by who filled the primary and secondary caregiver roles, and what their relationship to each other was. Using Random Forest also results in a measure of feature importance. This importance measure confirmed that the primary and secondary caregiver roles and their relationships were the most important features defining family structure.
United Methodist Foster Services: Factors Impacting Retention of Foster Parents Older Foster Children with Special Needs
The poster presentation for this project, presented at the 2018 Data Science for the Public Good Symposium in Arlington, VA, can be found here (the pdf may not show up online and it may need to be downloaded).
The United Methodist Foster Services (UMFS) were interested in using data from various points of contact between UMFS and foster parents in order to identify possibilities for interventions to improve foster parent retention and to improve stability of current foster placements in Richmond, VA. UMFS is specifically focused on older (teen) foster children with special emotional, behavioral, or social challenges; special medical needs; and histories of trauma or disruptions in the foster care system.
Though we were unable to obtain a significant quantity of data from UMFS over the course of the project timeline, we were able to complete a high-level demographic comparison of the UMFS foster parent and broader Richmond, VA foster parent populations. We found that the UMFS foster parents tended to be younger than the overall population of Richmond, VA foster parents. We also found that a higher proportion of UMFS foster parents were white compated to the Richmond, VA foster parent population.
We conducted a thorough review of the literature concerning foster care for children and teens with special medical, social, or behavioral needs. This review revealed that dissatisfaction with the child welfare agency and with case workers was one of the most common reasons for foster parent attrition. Foster parents were likely to become dissatisfied if they felt like they were not involved in making decisions for their foster children. Foster parents for children with special needs reported needing additional agency support and training. The willingness of families to foster children with special needs depended heavily on the nature of the foster child’s needs. For example, almost all foster parents were willing to foster children with speech or hearing problems, while a sigificant proportion were unwilling to foster children with terminal illnesses or with HIV.
The results of this literature search could be used by UMFS to develop a survey intended to provide information necessary for planning specific, targeted inverventions in the UMFS foster parent population.
Army Research Institute: Identifying Factors Impacting Community Embeddedness of Army Installations
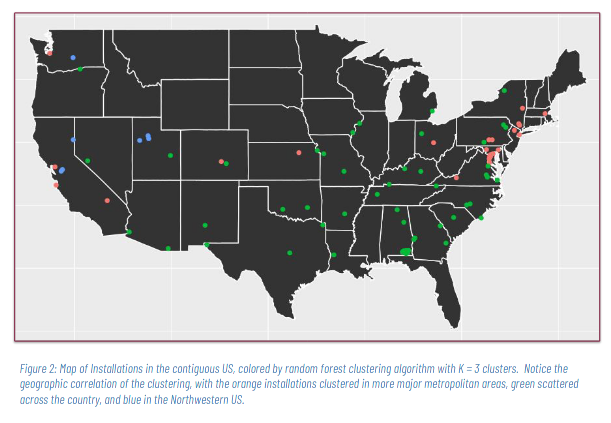
Figure 3: Geographic Clustering of Communities Based on Social Characteristics
The poster presentation for this project, presented at the 2018 Data Science for the Public Good Symposium in Arlington, VA, can be found here (the pdf may not show up online and it may need to be downloaded).
The aim of this project was to identify characteristics of communities that related, broadly speaking, to the embeddedness of solidiers in their communities. This was a large, multi-phase project. In the phase of the project I worked on summer 2018, we collected data from a range of publicly-available sources on the counties in which a number of army installations were based. These wide-ranging data may ultimately be linked with data provided by the ARI in order to attempt to associate county-level data with performance statistics about soldiers and installations.
As part of this project, we sought to identify meaningful “clusters” of communities with different defining characteristics, as these may represent distinct groupings that will respond similarly to similar interventions in the future. We implemented k-means clustering and partioning around medoids (PAM) clustering with Random Forest, and extracted variable importance measures with Random Forest. We found three fairly well-defined geographic clusters, one primarily representing California and New England, another the non-coastal west, and a third the South. Major factors that determined the clusters include cost of home ownership, cost of transportation, air pollution, and exercise access.
M.S. Thesis Project: Simulation-based Comparison of Tests for Heterogeneity of Risk Difference
Introduction
This project was my Statistics M.S. thesis, submitted in May 2018. The goal of the project was to present a bootstrap Q test for testing for heterogeneity of the absolute risk difference across a clinically-relevant covariate for time-to-event data. In many cases, typical approaches to estimating risk difference and the effects of relevant covariates, such as identity-link Poisson or binomial GLMs, fail to converge. Using simulated “patient” data, we compared the type-I error rates of the bootstrap Q test, an OLS-based test with Huber-White standard errors, and tests using identity-link Poisson and biomial GLMs to the nominal .05 type-I error rate. We also show the power of these approaches to detect heterogeneity of the absolute risk difference.
All of the code for the project was written in R.
NB: I have omitted all details concerning the implementation of the bootstrap Q test from the portfolio as it may pertain to my advisor’s future work. Though the thesis was primarily simulation-based, there were real data from the Strategic Timing of Antiretroviral Treatment (START) clinical trial; these data are confidential and have also been omitted.
Presentation
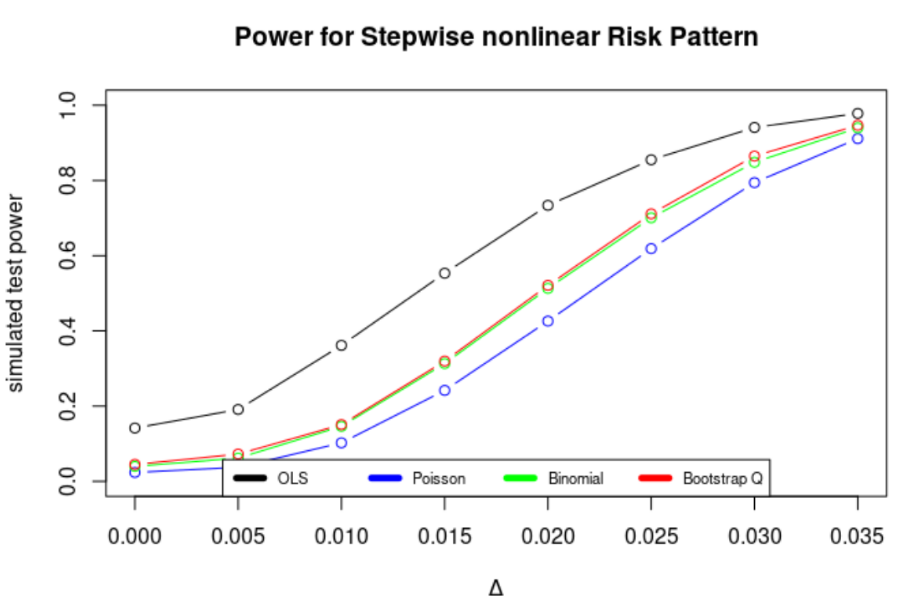
Figure 4: Power curves for the stepwise increasing risk pattern.
My thesis slides, assembled using beamer (slides in \(\LaTeX\)), can be found here: slides. Again, much of the content was removed because it contained either materials that my advisor may use in the future or confidential patient data. However, it sill provides a good overview of the methods employed and of the overall argument presented in the project.
Code Samples
Links to some of the code used in this project are shown below. This project was completed entirely using R.
Simulation Functions
These functions generate simulated “patient” data following different risk patterns. The functions in this file were a foundational part of the whole project as the various methods employed in the project were tested on simulated data. Parameters included in the simulation are:
- Number of patients
- Covariate representing arbitrary patient characteristic impacting risk of an event. Examples of such covariates include age or the concentration of a biomarker of interest. Examples of events include mortality or disease progression. In this case, the covariate is Uniform(0,100) distributed; this is a simplifying assumption that allows us to better illstrate the impact of varying the relationship between the covariate and risk of event.
- Person-days follow a truncated Gamma distribution; converted to person-years after sampling.
- Patterns of association of risk difference with the covariate. We considered four different patterns of association:
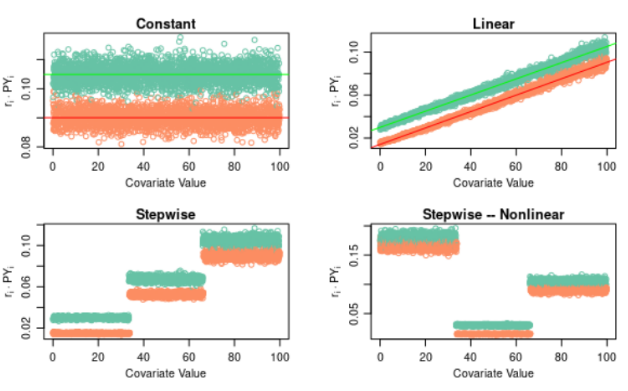
Figure 5: Simulated risk patterns. Blue represents the control group; red represents the treatment group.
- Constant: \(r_0\) and \(r_1\), the event rates for patients in the control and treatment groups, respectively, remain flat, with \(r_0\) higher than \(r_1\) (indicating that untreated patients have a greater risk of experiencing an event). The risk of event, in this situation, does not depend on the covariate.
- Linear Increasing: \(r_0\) and \(r_1\) increase linearly in the covariate of interest. Under the null hypothesis (no heterogeneity in risk difference by covariate value), the slopes are the same but the intercepts are different.
- Stepwise Increasing: \(r_0\) is higher than \(r_1\) and the difference between them remains constant under the null hypothesis. Risk increases in distinct stages – that is, there are well-defined cutpoints in the covariate where the risk increaeses.
- Stepwise Nonlinear: This is the same as the stepwise increasing risk association pattern except that the risk is not necessarily increasing. In the particular pattern of association considered in the project, there are three distinct subgroups; in the first and third, the risk is higher, while for the middle subgroup, it is lower. This could represent a scenario where age is the covariate of interest and very young and very old patients have the greatest underlying risk of exepriencing an event.