Contents
Introduction
In this post, I go over the process for exporting high-resolution graphics of the desired size with consistent layouts and font sizes. In the past, when experimenting with size changes, I would run into the following problems:
- Figures exported using the default options would appear fuzzy/pixelated when posted online.
- Manually resizing figures would result in stretched or otherwise distorted figure elements (especially text)
- Specifying higher resolutions in R would result in text that did not match the anticipated font sizes and other plot elements that appeared excessively large or excessively small.
I will not go into the nuts and bolts of how and why the following approches work – lots of dividing by pixel counts. I will instead show the basic approach to export high-resolution figures under both base R and ggplot. Note that I will be focusing on png images. In some cases, it may be preferable to use a vector-based format such as svg or eps, but that is beyond the scope of this post.
The key points, under both base R and ggplot, are:
- explicitly specify the font size
- explicitly specify the width and height of the plot (ideally in inches, as resolution is specified in ppi, or pixels per inch.
- export the figure with, e.g.,
png()orggsave(), instead of copying or exporting fromRStudioafter interactively resizing the figure. This is, in large part, to ensure reproducibility.
Base R
In base R, most of the work of exporting high-quality graphics occurs in the function used to export the figues (in this case, png()). We use pointsize to specify the font size; width and height to specify the dimensions of the figure; units to specify the unit of the arguments passed to width and height (in this case, inches); and res to specify the resolution in ppi.
Here we compare a figure exported with default options to one exported with all of the above details specified. Note that we have saved the path argument as a variable (not shown).
Figure in Base R with Default Options
path = "../static/images/hi-res-figs-01222020"
x <- 1:10
y <- x*abs(rnorm(10))

png(filename=paste(path,"/lowres.png",sep=""))
plot(x~y, main="The Title")
abline(lm(x~y))
dev.off()
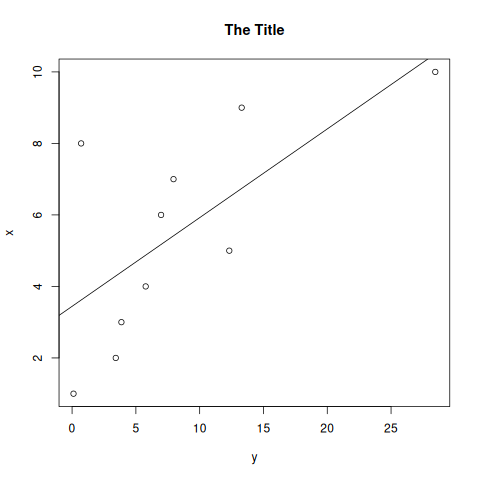
This looks fine on my 1080p display. On higher resolution displays, or after zooming in just a bit, it doesn’t look as good.
High-Resolution Figure with Incorrect Figure Component Dimensions in Base R
Let’s try increasing the resolution without carefully specifying the dimensions, font size, etc. We are going to increase the ppi to 200 (the default is 72).
png(filename=paste(path,"/hires-nosettings.png",sep=""), res=200)
plot(x~y, main="The Title")
abline(lm(x~y))
dev.off()
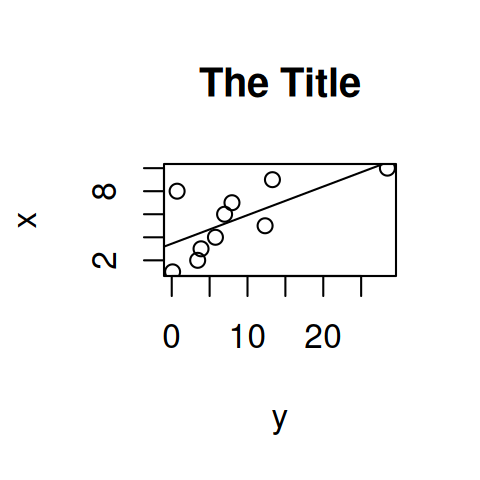
This is pretty clearly not what we want! We have now made all of the figure elements huge while keeping the plot constrained to the same small area.
High-Resolution Figure with Correct Font Sizes in Base R
Let’s fix this by specifying the font size and fixing the dimensions. We will create a 5 inch by 5 inch (the R default) 300 dpi image while preserving the correct sizes of elements in the figure. We also specify a 14 point font.
png(filename=paste(path,"/hires.png",sep=""), width=5, height=5,
    units="in", res=300, pointsize=12)
plot(x~y, main="The Title")
abline(lm(x~y))
dev.off()
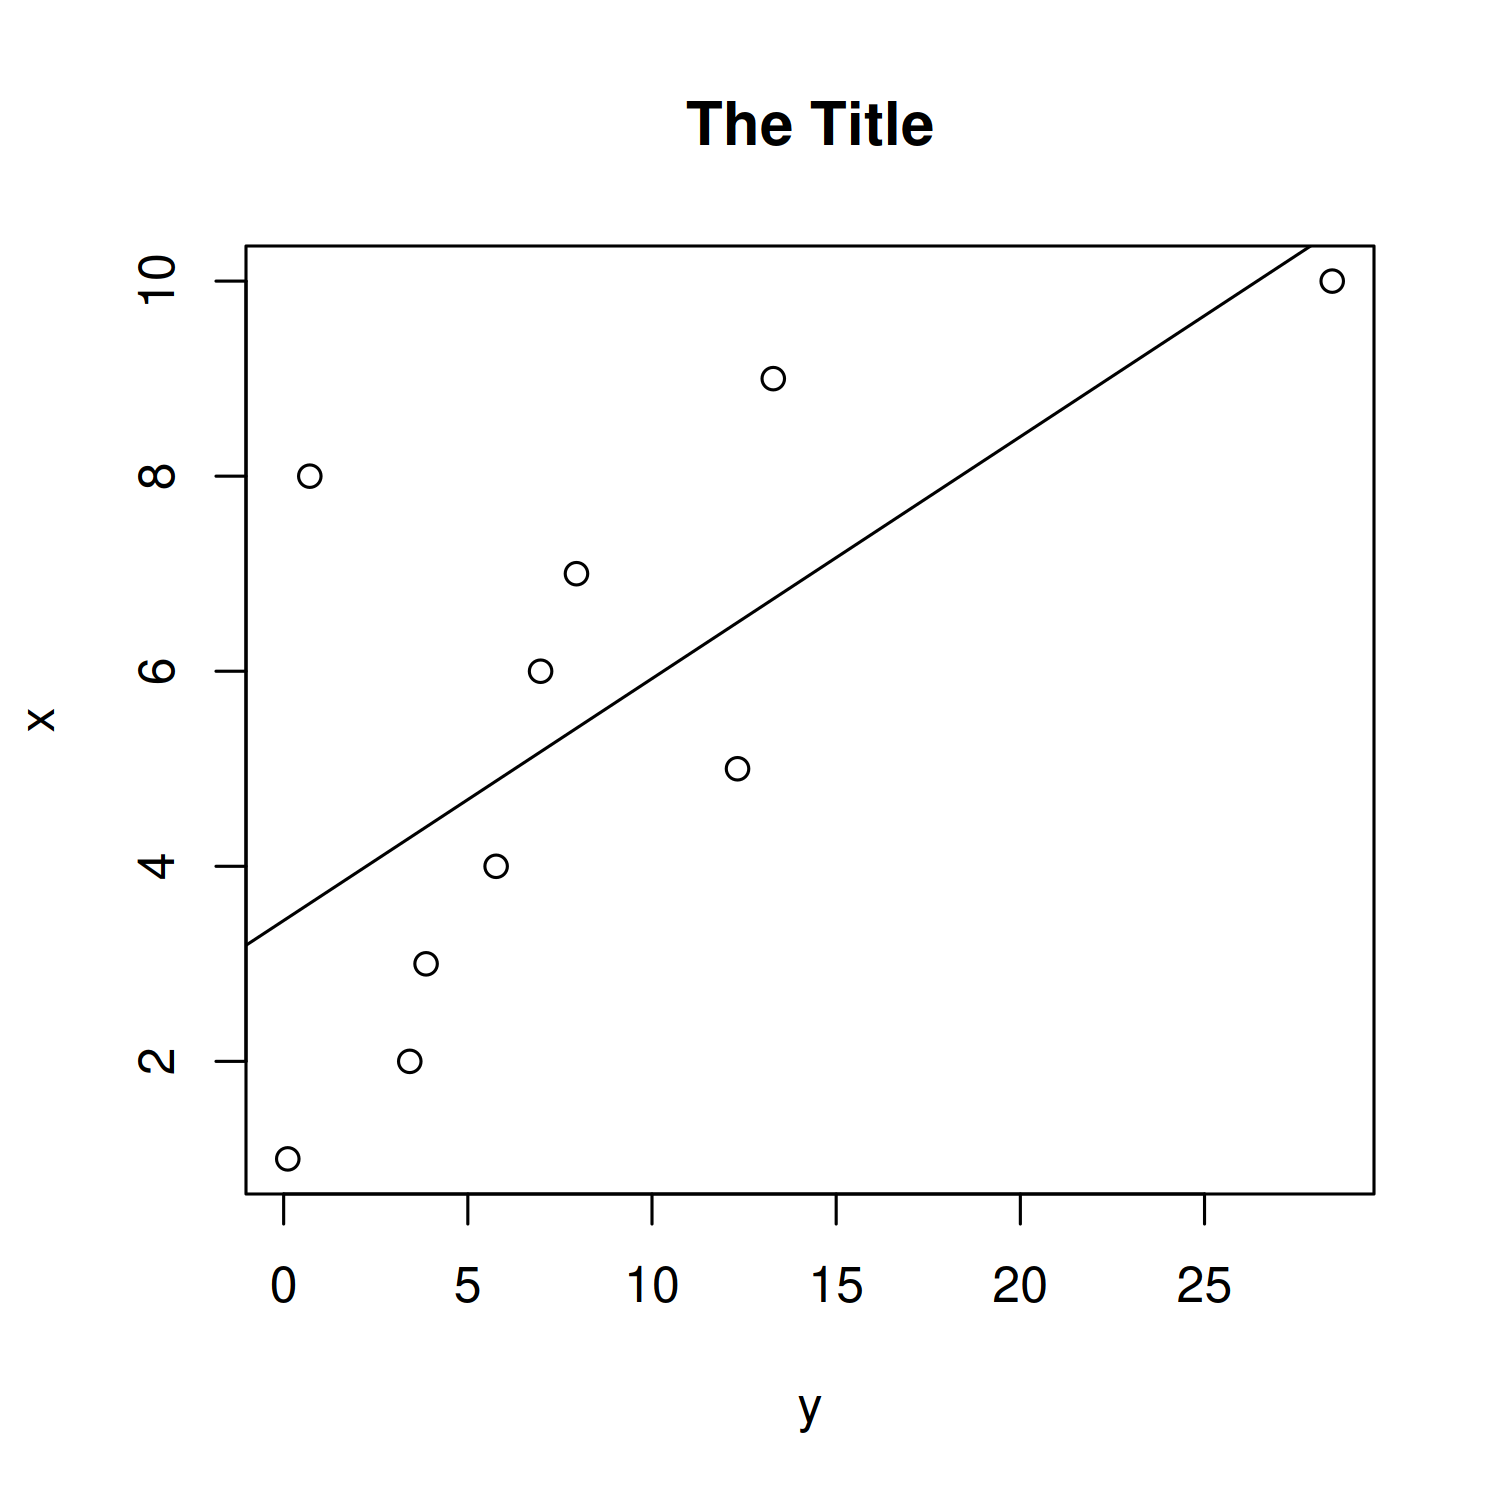
This figure looks good. The fonts sizes are as specified, and unless you zoom in very, very close, the image does not look pixellated.
Note that the pointsize argument also controls the size of the points (not just font size): a small pointsize will result in small points. The sizes of individual components (e.g. title, axis labels, points, lines, etc.) can also be controlled individually, but that is beyond the scope of this post.
High-resolution figures in ggplot
We will repeat the same general procedure as above using the ggplot2 package.
Figure in ggplot2 with default options
library(ggplot2)
ggplot_example <- ggplot(data.frame(x,y), mapping=aes(x=x,y=y)) +
  geom_point() +
  geom_smooth() +
  ggtitle("The Title")
ggsave(filename="gg-default.png", plot=ggplot_example, device="png", path=path)
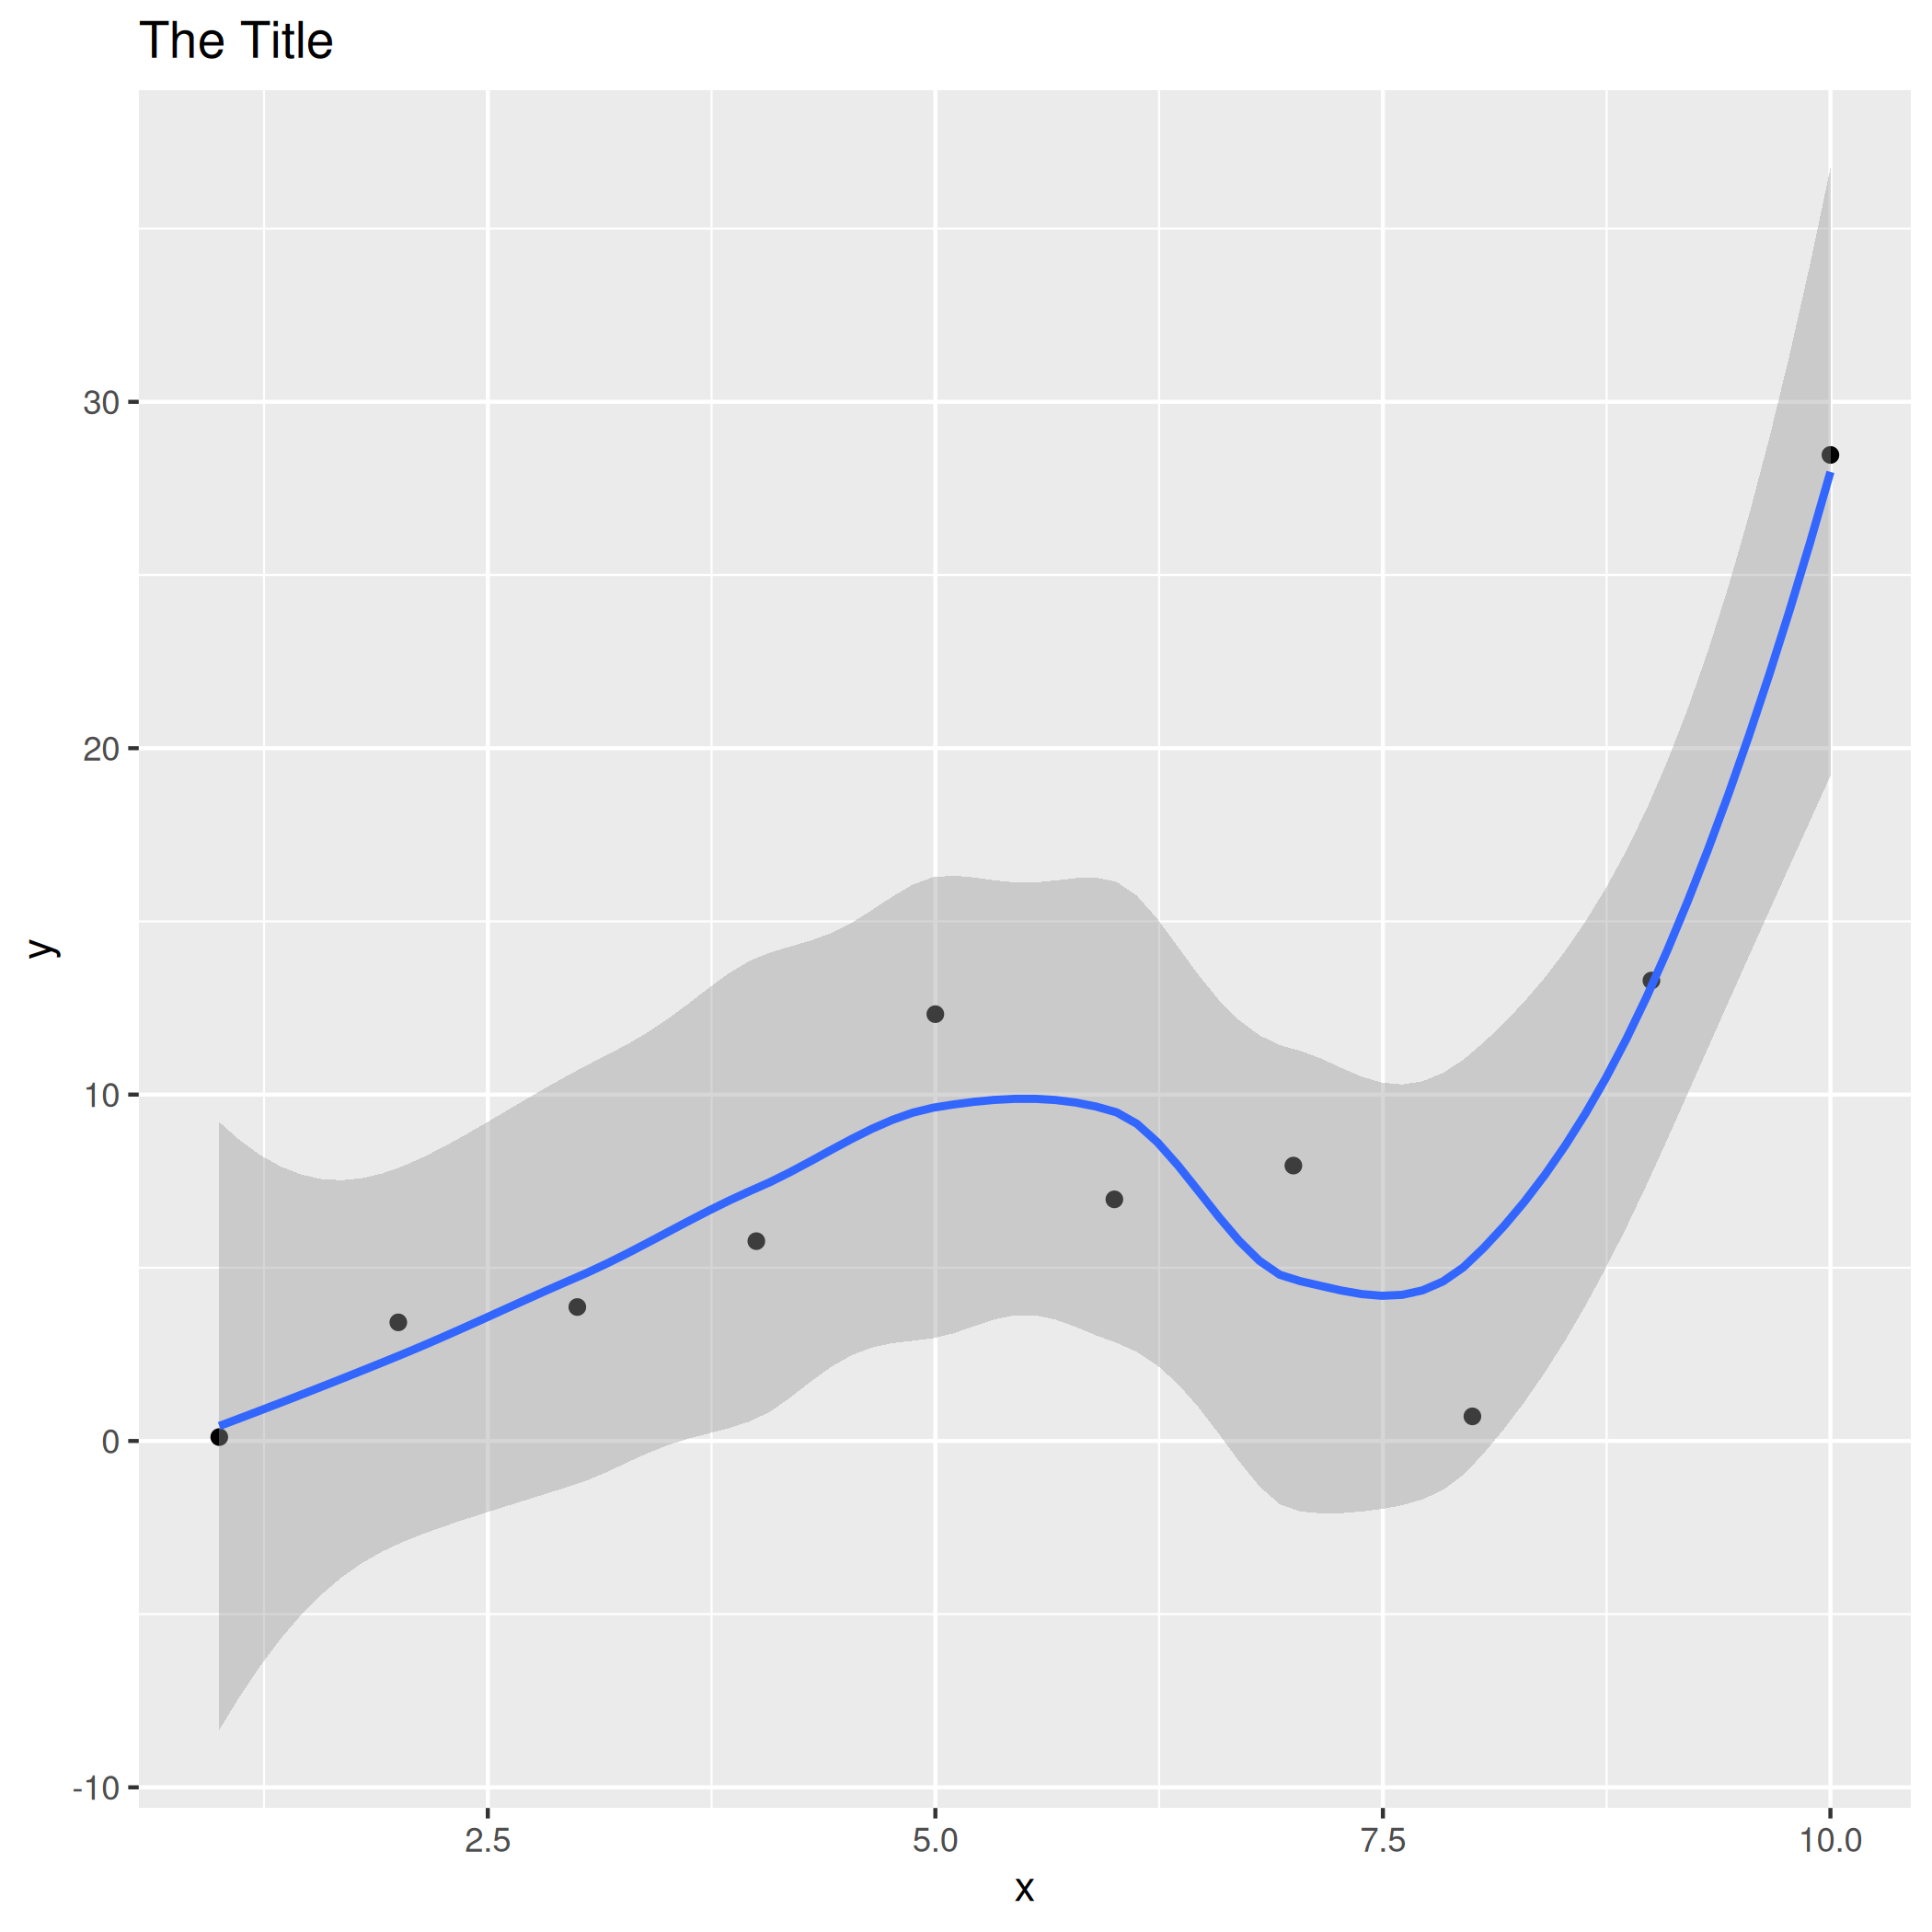
This doesn’t actually look half bad! ggsave attempts to use reasonable defaults. In particular, it defaults to 300 dpi.
Figure in ggplot2 with higher resolution
Let’s leave the size alone and see what happens when we try to increase the resolution. We probably would not have to do so as 300 is sufficient in most cases.
ggsave(filename="gg-higher-res.png", plot=ggplot_example, device="png", path=path,
       dpi=500)

This still looks great! Let’s finish by specifying some fonts and size the figure down to the 5 inch by 5 inch used before.
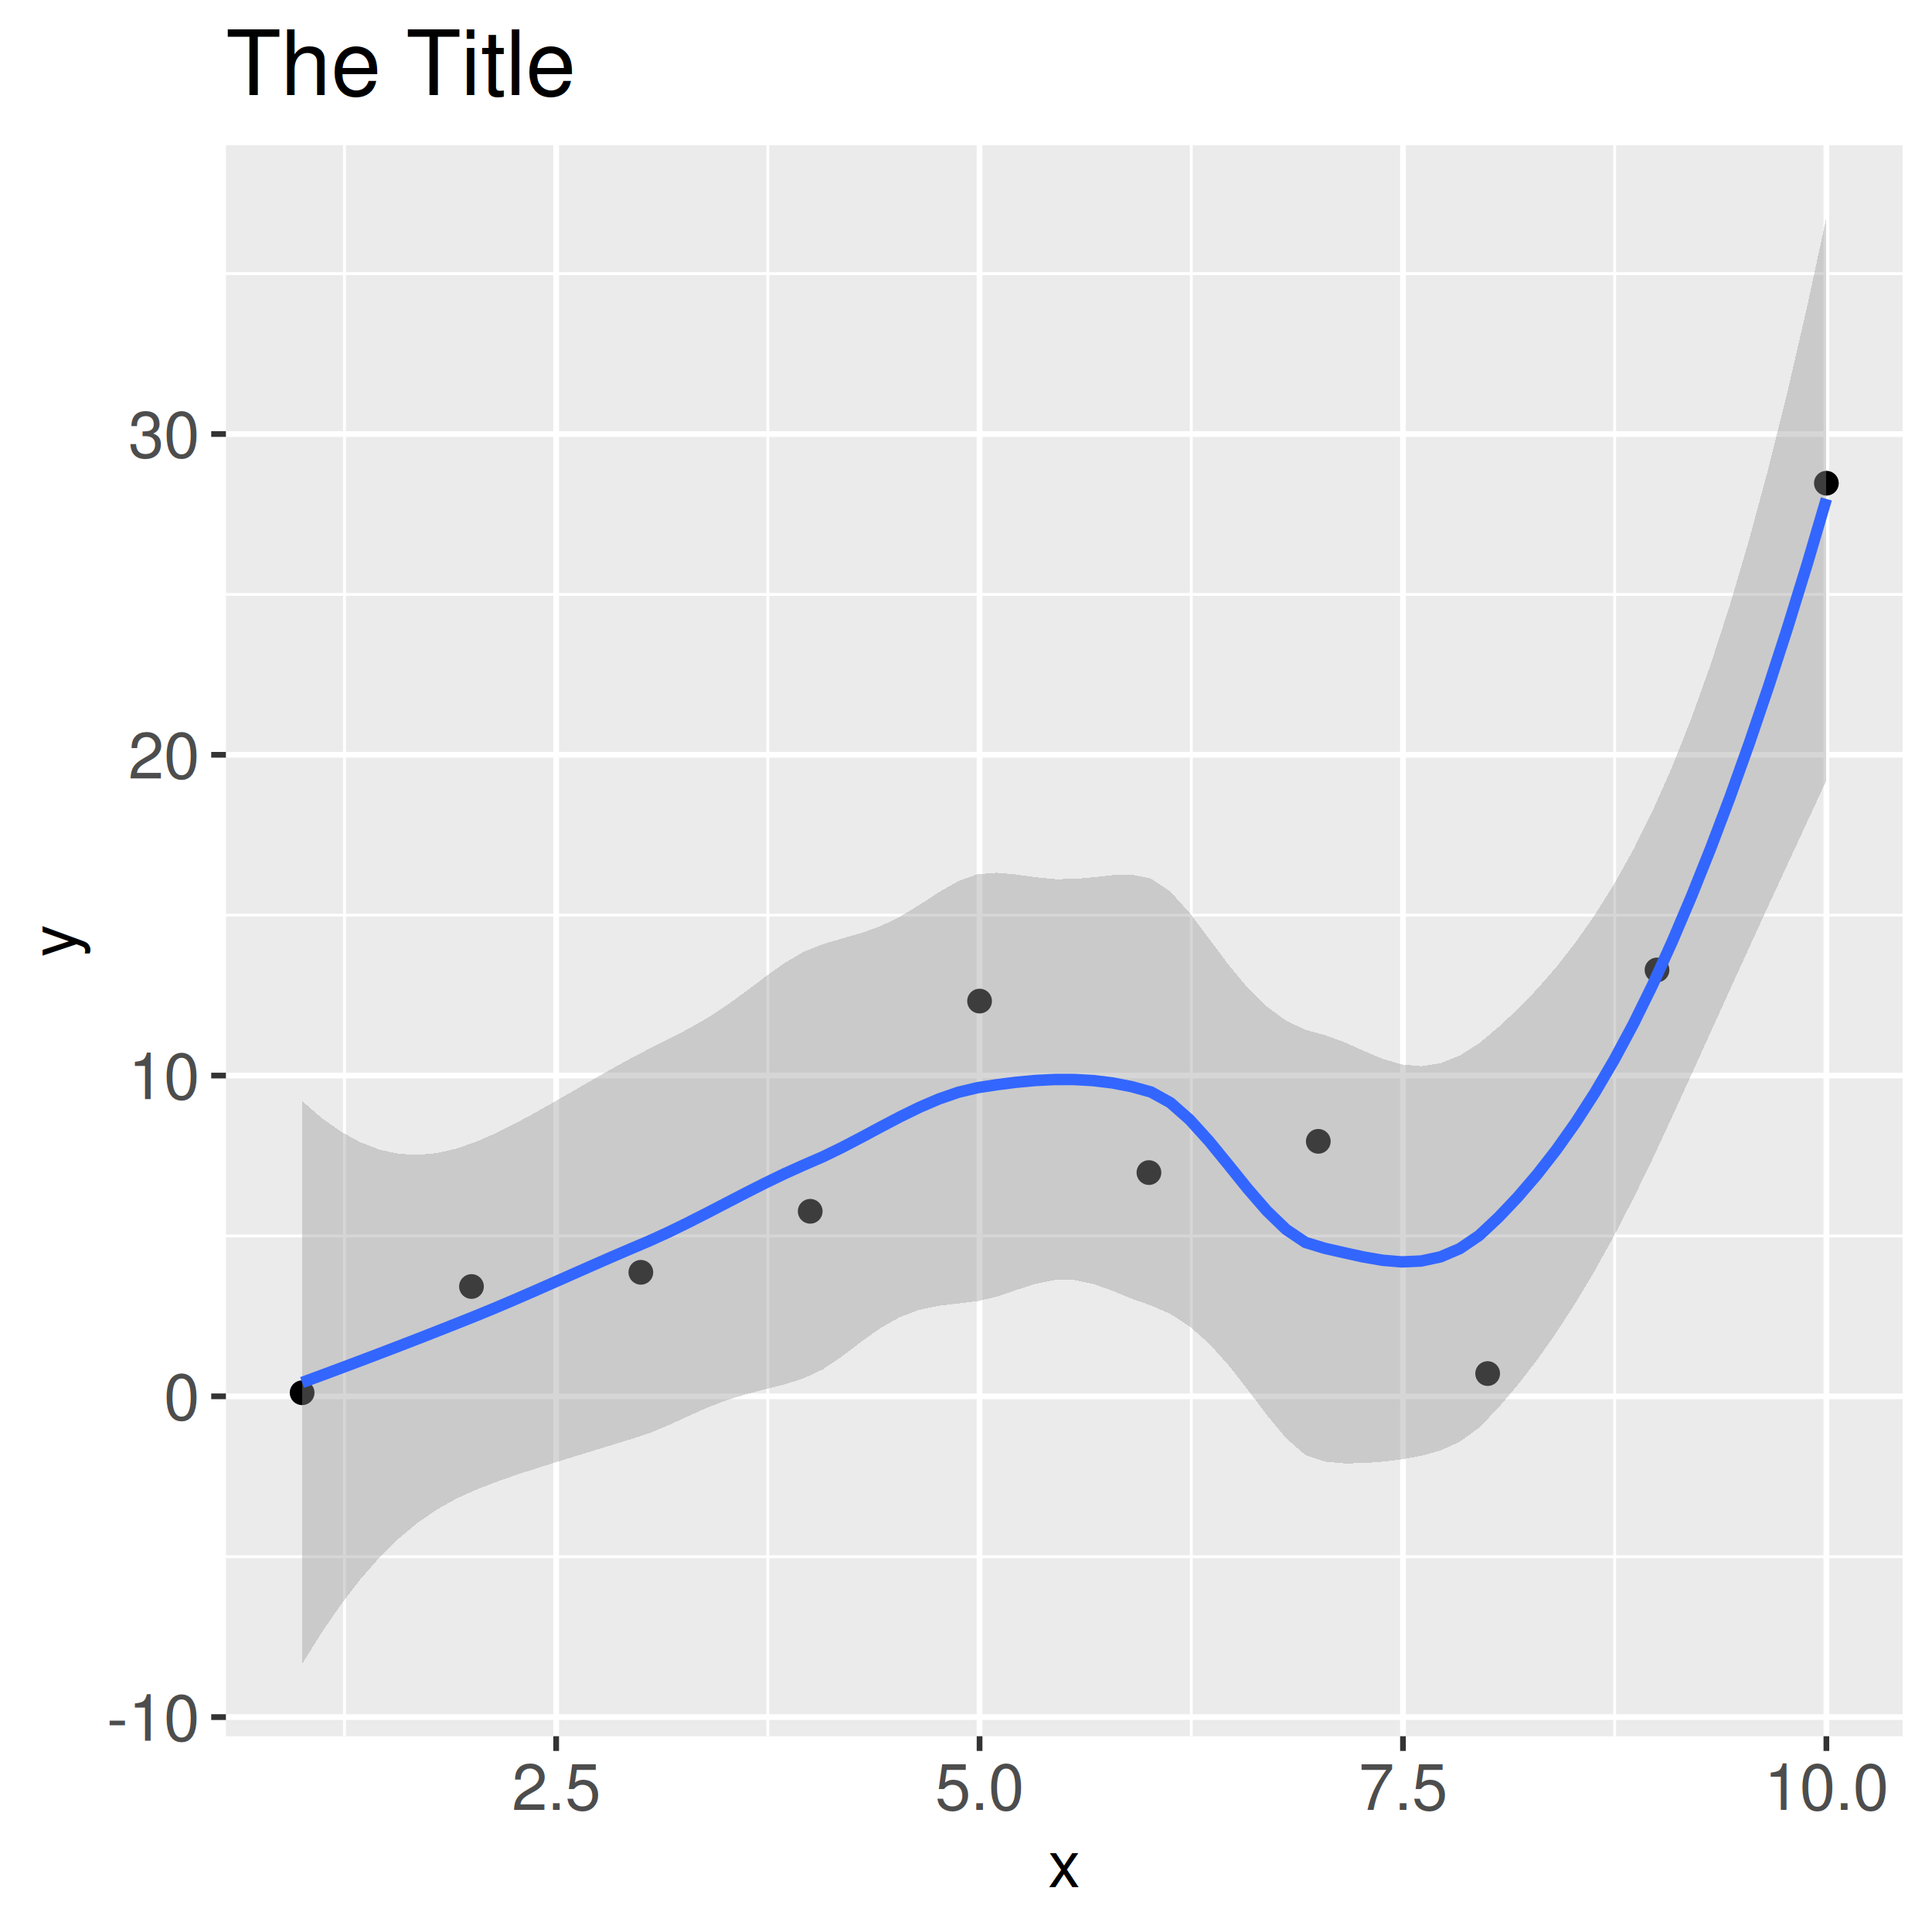
Formatted, high-resolution ggplot2 figure
ggplot_formatted <- ggplot_example +
  theme(title=element_text(size=14, hjust=0.5),
        axis.title=element_text(size=12),
        axis.text = element_text(size=12))

ggsave(filename="gg-formatted.png", plot=ggplot_formatted, device="png",
       path=path, height=5, width=5, units="in", dpi=500)
In summary, ggsave is a reliable option with reasonable defaults. Base R graphics require a little more work, but it is still feasible to export high-quality graphics.