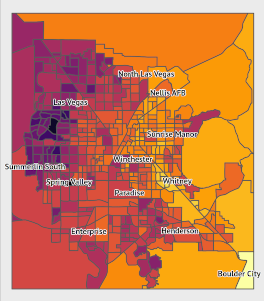
Background For the past several months, I have been working on an analysis on the effects of urban heat on vulnerable populations, particularly during a public health crisis. For some background, I currently live in Las Vegas, where summer heat can exceed 110 degrees. Last summer included a 45-day-long streak of temperatures over 100 degrees.
Urban heat is not distributed evenly within cities. Features such as parks or ponds can lead to cooler temperatures in some areas, while areas without foliage or with dark surfaces such as roads and buildings lead to warmer temperatures.
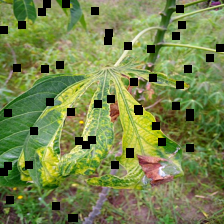
Introduction Below is the output of an iPython notebook covering the process of transforming images for deep learning applications in the fastai library. In particular, it shows how to use the many transformations in the Albumentations library within a fastai DataBlock.
A Brief Note I’ve made a number of these small guides, but haven’t posted them here. I may do so in the future. In general, I want to be better about putting materials I generate here on my site in some format.
Note 2: Now that the 2020 Census has concluded, the embedded Shiny app has been shut down. I’ve left the code used to embed the app on the site, and I’ve linked to a blog post with screenshots of the app itself. But the app itself is no longer linked and no longer embedded here. Note: This post was updated on 2020-07-10 with a new version of the Shiny app.
I recently developed an R Shiny app for tracking the daily 2020 census numbers in Nevada.
Contents Table of Contents Contents Introduction Base R Figure in Base R with Default Options High-Resolution Figure with Incorrect Figure Component Dimensions in Base R High-Resolution Figure with Correct Font Sizes in Base R High-resolution figures in ggplot Figure in ggplot2 with default options Figure in ggplot2 with higher resolution Formatted, high-resolution ggplot2 figure Introduction In this post, I go over the process for exporting high-resolution graphics of the desired size with consistent layouts and font sizes.
In this post, we attempt to embed an interactive plot generated using plot_ly in this web page. The plot was generated in R. We are following this guide to embed the interactive figure.
Some context: the figure below depicts the change in enrollment in health insurance through the HealthCare.gov marketplace (the federal marketplace established through the Affordable Care Act) from coverage year 2019 to coverage year 2020. A static version of this figure was made using ggplot.
2020-01-08
2 min read
Introduction and Perspective In this post, I am briefly reviewing the draft of Andrew Ng’s Machine Learning Yearning, which can currently be obtained for free here. This is a work in progress, so my comments will be brief and not particularly critical. I obtained the copy I read on May 11; the page numbers and content may have changed since then.
I read the book because I have not had the chance to do too much machine learning work in the recent past.
I added a new section to this website! It is a work in progress (currently a long wall of text), but it will serve as a portfolio of some of my data science and statistics projects. I will be updating it in the coming days and weeks with more code snippets and visualizations.
You can keep an eye on it here. The link can also be found at the top of this page.
Introduction In this and some of the following posts, I’ll be trying something a little bit different (and a little more aligned with the original intent of this site). I’m going to be writing about perceptrons and the perceptron learning algorithm. The perceptron learning algorithm was developed by Frank Rosenblatt in the late 1950s, making it one of the oldest machine learning algorithms.
I’m tentatively planning four posts on this topic: the first will provide some background and context, explaining what the “perceptron” is and what motivated its development.
Introduction In this post, I outline the basics of setting up and using OpenBUGS on linux. BUGS stands for Bayesian inference Using Gibbs Sampling. OpenBUGS allows for the analysis of highly-complex statistical models using Markov-chain Monte Carlo methods. It is specifically focused on Bayesian methods.
This guide may not be generalizable to all Linux systems, but it worked for me. It wasn’t too difficult, but I did have to pull together a number of different sources to get everything working as intended.
One of the first books I’ll be working (partially) through is Introduction to Linear Optimization (Bertsimas and Tsitsiklis 1997). I recently took a statistical computing class that covered a selection of optimization topics. Though the course was far from comprehensive, it highlighted the value of having a range of optimization techniques, and a thorough grounding of how they work, in your toolbox. I will be working through the first four or five chapters of this book before moving onto nonlinear programming.